Building a better Zabbix frontend
posted | about 7 minutes to read
tags: zabbixweb projects web development
Recently, I ended up looking into Zabbix as a server monitoring solution. I was very impressed, but I felt that the reporting features left something to be desired; they were very robust, but it was hard to get all the information I wanted on one page.
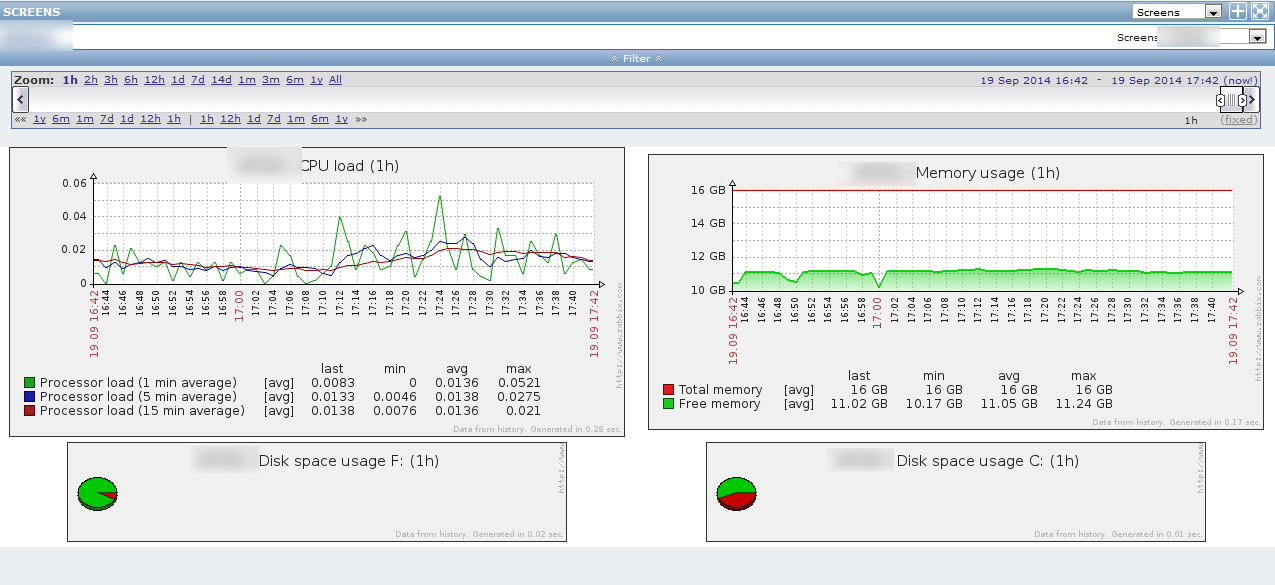
Zabbix’s bulky monitoring screens
It was great for monitoring one server on a screen – giving me history of resource usage in pretty graphs and so on – but there really wasn’t a good way to get a view that would give me all of this information in a compact manner for all of the servers I wanted to monitor, at the same time. (Plus, some of the graphs are more than just a little misleading; look at that RAM usage graph! The bottom of the graph is 10 GB – what?!)
So, instead of struggling through Zabbix monitoring using a hilariously bulky system, I took a page out of Phyramid’s book. They used a Node.js server as their monitoring solution, with aprebuilt API client available on GitHub. I thought that was really freaking cool, but there were a few problems that prevented me from implementing an identical solution.
Challenges
The biggest issue, of course, was that I wasn’t running a Node server, meaning that I couldn’t pull in the zabbix.js library. That meant I had to figure out how to talk to the Zabbix server myself. This was interesting for me, because it meant I had to learn a few different things. First, I had to figure out the Zabbix API itself, which was interesting – the documentation is extensive, but not exactly easy to understand, and the examples are fairly limited. Second, I had to put together something in JavaScript to talk to the API – something of a challenge, because I had no idea where to start with writing my own jQuery plugin. Other problems would arise as the project moved forward, of course, but these were the biggest things that came up immediately.
Learning the API turned out to be a lot easier than I expected. Basically, the only call I needed to actually make to the server was the host.get call. What this one did, when properly filtered, was give me all of the information I needed for every server that I had set up monitoring for, including a full inventory with current usage statistics as well as any errors or alerts associated with the server.
Getting the call to go to the server was a problem, though. My initial implementation of a Zabbix API client was basically just a modification of the Node.js library to make it work in a traditional environment. In fact, it was mostly just plain old JavaScript with a touch of jQuery to do an AJAX call. Was it good? No. But it worked.
My API call returned a bunch of data – quite a bit to sort through, to be honest. It was formatted kind of strangely, too. There were some properties on the top level of the JSON object that it returned, and others that I needed were in an ‘items’ array. Some of these required cycling through multiple entries to get results – like figuring out disk usage when there were multiple hard drives on the system.
The full response that I received from the Zabbix server. So much data to parse through!
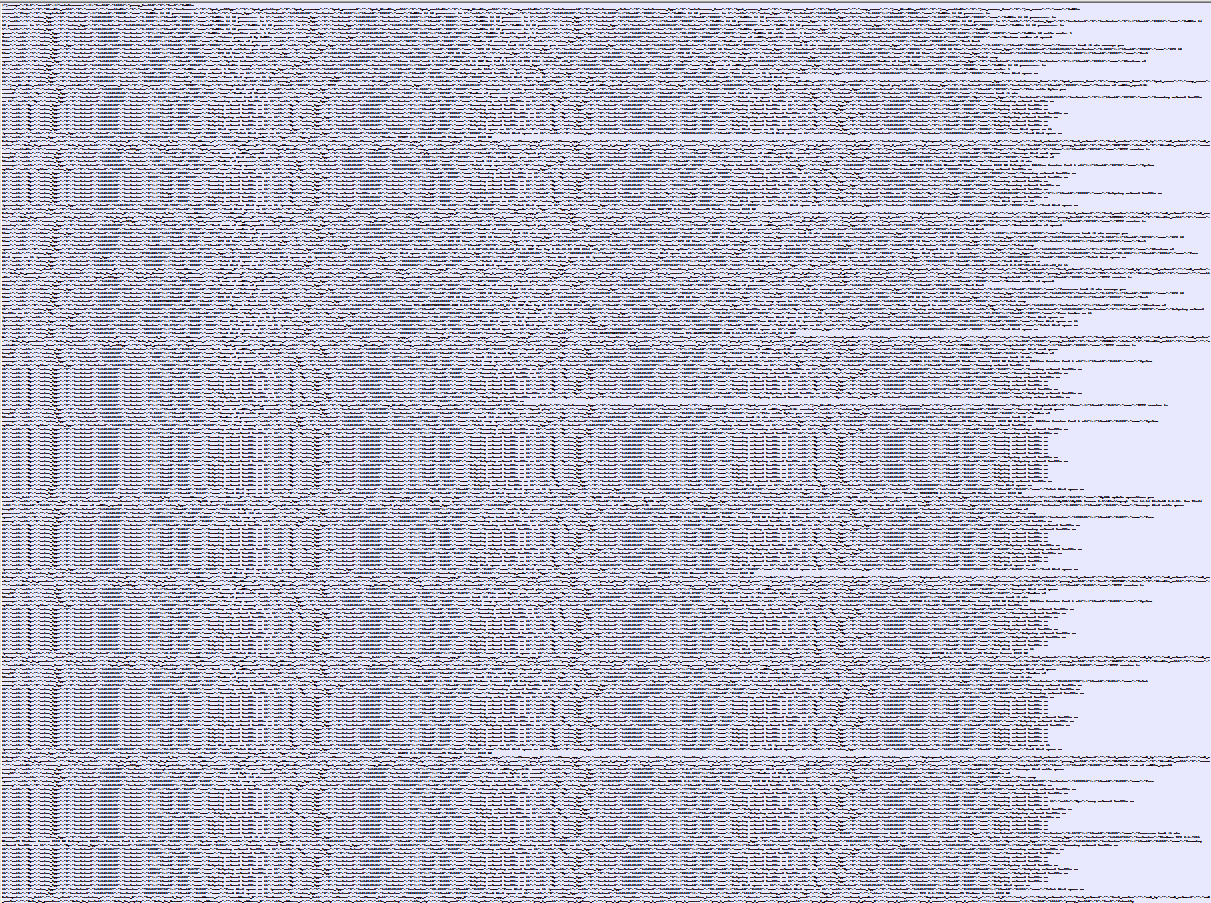
I wrote more JavaScript to handle that, naturally. By this time, I’d written more JavaScript than I had for anything I’d ever written before. The page itself was 95% JavaScript (mostly jQuery, to be honest) – the other 5% being the empty div tags that I put the data in! I was able to eventually get everything put together, though, and get it parsed into something usable. All that was left was to get it displaying nicely on the screen.
Displaying the Data
Now that I had all of my Zabbix data, I faced the challenge of actually making it look nice. I settled on a Bootstrap grid layout with meters showing the CPU and RAM usage, with separate text for disk capacities and network stats. Kottenator’s jquery-circle-progress plugin worked really well for the meters – my only frustration was no radial gradients, but at the end of the day that’s really more of a CSS limitation than anything else. It certainly wouldn’t stop me from recommending this plugin.
I wanted to use the meters for disk usage, too, but that just wasn’t an option – some of our servers only had one drive, while others had as many as four. Doing meters wouldn’t have fit nearly as nicely into the grid layout I had planned.
I finished off the first take on the layout with an alert system – whenever something went wrong, like the web service or the server being unreachable, that server’s grid area would flash red, a tornado siren sound would go off, and the screen would display whatever error message that Zabbix threw for that server instead of displaying the meters.
The original frontend design.
The first iteration of the display worked fairly well. The data displayed, at least. Unfortunately, it just took up too much real estate per server. I was trying to display the data on a TV hooked up to a Raspberry Pi, and could only fit 8 servers on the screen. It just wasn’t good enough. I had to improve the layout and make it more of an “at-a-glance” display, so I decided to make four major visual changes.
Refinements
First, I condensed the “Disks” display into a Bootstrap collapsible accordion, meaning that I could just have a button instead of a long list. I went one step further, though – since disk usage is still pretty critical information, I decided it would be best to make sure that critically low disk space would still be visually represented. I used the panel-warning and panel-danger classes to change the color of the button whenever disk usage hit 75% or 90% respectively, and suddenly it became easy to spot potential issues from across the room.
Second, I condensed the text that was displayed for the operating system. Instead of displaying the raw string, I filtered the OS info that Zabbix gave me and output a human-readable string like “CentOS 6.5″ or “Win Server 2008 R2″. I also moved it right next to the name of the server, so everything would appear on one line.
I also swapped the Bootstrap theme to a sleeker, higher-contrast theme, which helped as well; it made it easier to see the board from across the room by providing a bigger difference between the white text and the black background.
Finally, I modified the jquery-circle-progress plugin so that all of the meters were no longer circles – instead, I made them semicircles. This was a bit of a challenge for me, but it both saved space and made the meters more intuitive.
The new Zabbix frontend with all of the changes.
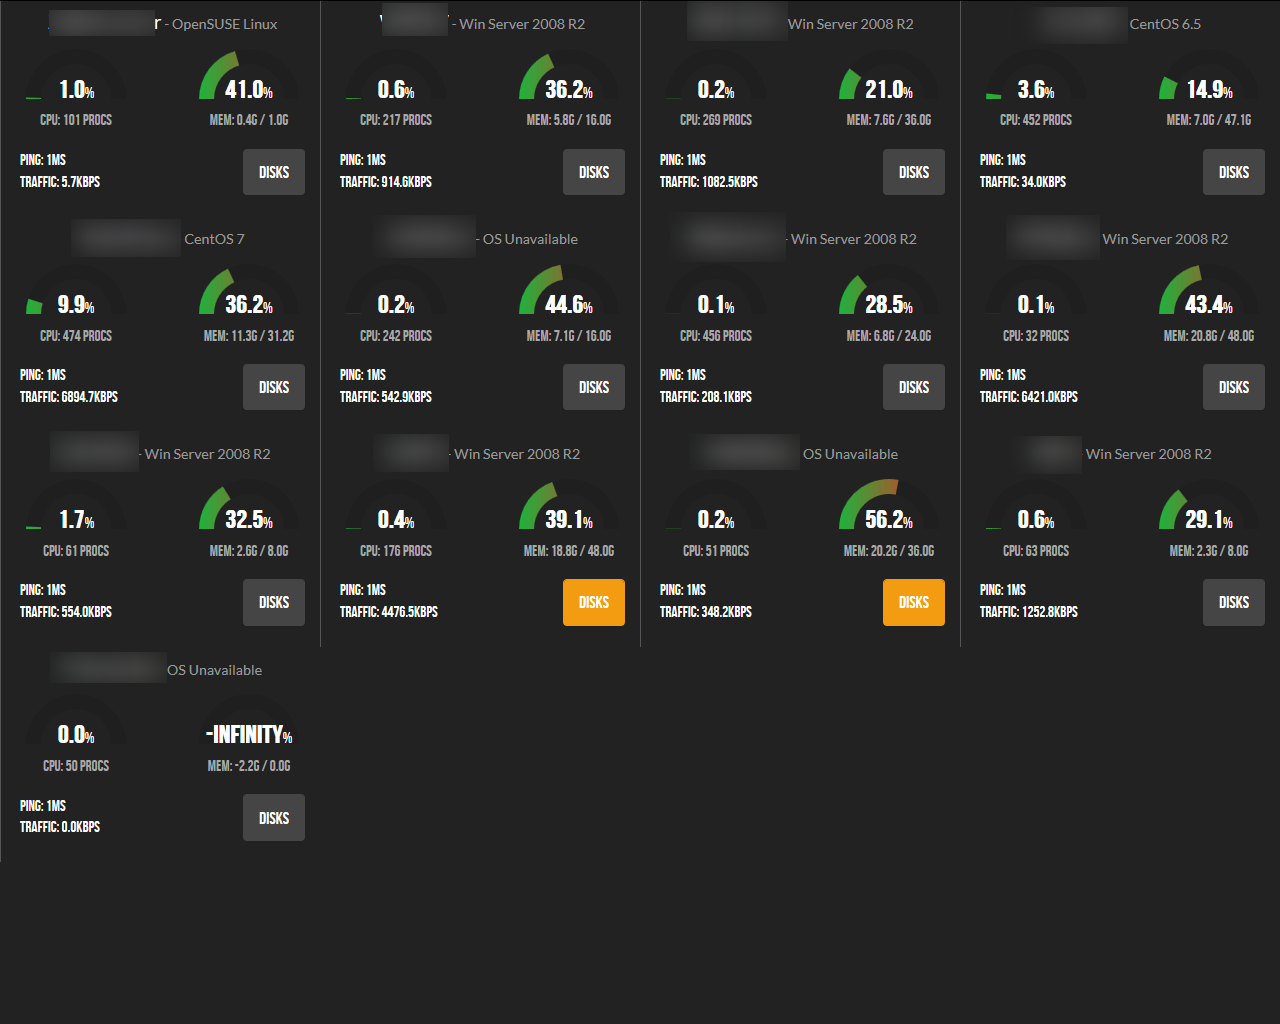
Once I put all of these changes together, it turned out to be a very workable system. We’re now able to display up to 16 servers on the same screen, and it looks pretty beautiful to boot.
We’re currently in the process of getting this display put up on a large screen here in the office so that we can see immediately when a server or web service goes down. So far, it’s been working really well, and I’m excited to put it into production.
Interested in trying it out for yourself? I’ve made a versionavailable for download; please credit me if you use it. If you’re sickened by the awful Zabbix library that I wrote, check out jqZabbix on GitHub; it’s a much more solid Zabbix API client.
I’ve been doing a lot of cool tech stuff recently, so you’ll probably see more blogs in the same vein as this one soon; I’ve already got one planned for MyLeaf, a “what should I read next” application I built for a friend a month or two ago, as well as a preview of my next big project.